
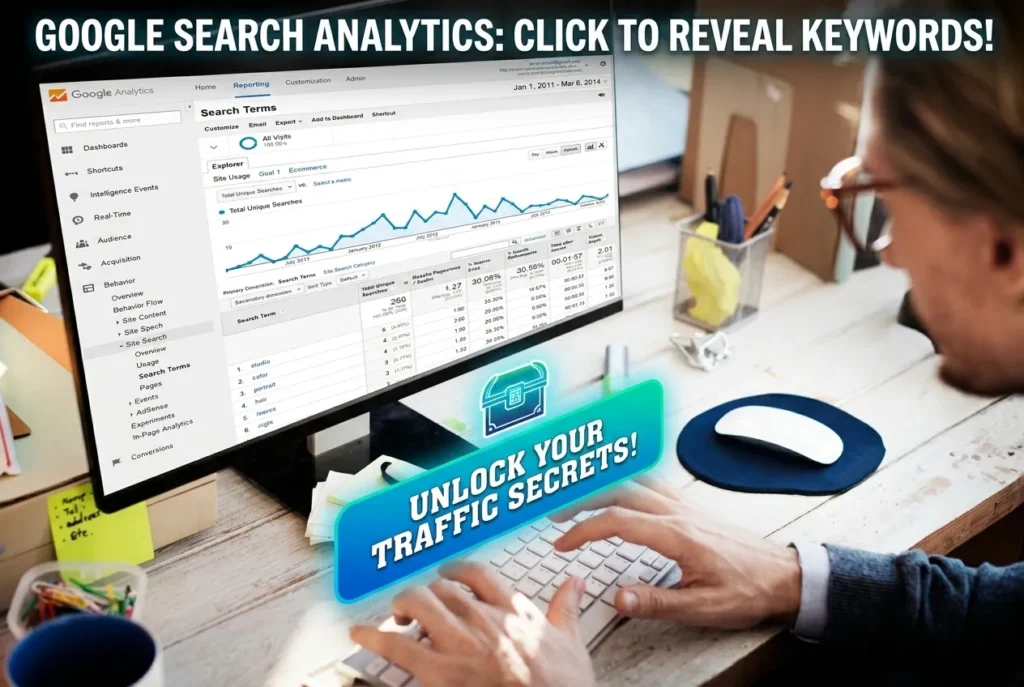
Google search analytics is the set of data Google gives you about how your website performs in Google Search: how many times your pages appeared (impressions), how many times people clicked (clicks), your click-through rate (CTR), and your average ranking position. You find it in the Performance report inside Google Search Console, and developers can also pull the same data through the Search Analytics API.
If you publish content online, google search analytics is the closest thing to a direct line from Google to you. It shows which queries bring people to your site, which pages earn the clicks, and where you are leaving traffic on the table. In this guide you will learn exactly how to read it, how to filter it, and how to turn the numbers into more traffic. Whether you are a blogger, a marketer, or a site owner who just installed WordPress, you can follow along step by step. You can also explore our free online tools at EveryToolfy to support your SEO workflow.
Quick answer (featured snippet): Google search analytics is the performance data in Google Search Console that reports clicks, impressions, average CTR and average position for your site across queries, pages, countries, devices and search appearances. It is free and updates daily.
Key Takeaways
- Google search analytics lives in Search Console → Performance, and it is completely free.
- The four core metrics are clicks, impressions, CTR and average position.
- You can slice the data by query, page, country, device, search appearance and date.
- Search Console data is different from Google Analytics data, and you need both.
- Use the data to find quick-win keywords, fix low-CTR pages, and spot content decay.
- The Search Analytics API and Looker Studio let you go beyond the 1,000-row interface limit.
What Is Google Search Analytics?
Google search analytics is the reporting layer of Google Search Console that tells you how your website appears and performs in Google Search results. Google originally called this feature “Search Analytics,” and the name stuck even after the interface was rebranded as the Performance report. The official Performance report documentation describes it as the place to see how often your site appears, what queries trigger it, and how often people click.
In simple terms, every time someone searches on Google and your page appears in the search engine results page (SERP), Google records an impression. When the person clicks through, Google records a click. Over time, those records add up to a detailed picture of your organic visibility.
Unlike third-party estimates from tools such as Semrush or Ahrefs, google search analytics is first-party data. It comes straight from Google, which makes it the most trustworthy source for your own site’s search performance. You can read more about the history and purpose of the tool on Wikipedia’s Google Search Console page and in Google’s own About Search Console guide.
The Short History
The tool began life as Google Webmaster Tools. In 2015 it was renamed Search Console, and in 2018 Google launched a redesigned version with the Performance report replacing the older Search Analytics report. The developer endpoint, however, kept the original name, which is why you still see “searchanalytics” in the API documentation.
Why Google Search Analytics Matters for SEO
Search engine optimization is a game of feedback loops. You publish, Google ranks, users click, and you adjust. Without data you are guessing. With google search analytics you can answer questions that no keyword tool can answer for you:
- Which exact queries already send visitors to my site?
- Which pages rank on page two and are one improvement away from page one?
- Which pages get thousands of impressions but almost no clicks?
- Did my last update, redesign or migration help or hurt?
- Which countries and devices bring my audience?
If you want a refresher on the discipline itself, Moz’s beginner guide to SEO and the Wikipedia overview of search engine optimization are good starting points. Google also publishes an excellent SEO Starter Guide that explains how its systems discover and rank pages.
The key idea is that rankings alone are a vanity metric. Clicks and impressions are the real outcomes, and search analytics is where you see them.
How to Set Up Google Search Console
Before you can use google search analytics, you must verify that you own your website. The process takes about five minutes.
- Go to Google Search Console and sign in with your Google account.
- Choose a property type. A Domain property covers every subdomain and protocol, while a URL-prefix property covers one exact address.
- Verify ownership. For a domain property you add a DNS TXT record. For a URL-prefix property you can use an HTML file, an HTML meta tag, your Google Analytics account or Google Tag Manager.
- Submit your XML sitemap so Google can find all your pages. Google explains the format in its sitemaps overview.
- Wait. Data usually begins to appear within a day or two, although historical data is not backfilled.
Setting Up on WordPress
If your site runs on WordPress, you have two easy options. The first is the official Site Kit by Google plugin, which connects Search Console and Analytics and shows the key numbers right in your dashboard (you can also find it on the WordPress plugin directory). The second is to verify through Yoast SEO, which lets you paste a verification code in its webmaster tools settings. Learn more about the plugin at Yoast.com.
Pro tip: Always add the Domain property. It captures data from both
wwwand non-www, and fromhttpandhttps, so you never miss traffic because of a version mismatch.
The Four Core Metrics Explained
Every number in google search analytics comes from four metrics. Understanding them deeply is the foundation of everything else.
1. Clicks
A click is counted when a user clicks a result on Google that takes them to your site. Clicks are the closest metric to actual organic traffic. Note that a click on a result that opens a Google feature (such as an image preview) might behave differently, so always check the official definitions.
2. Impressions
An impression is counted when your URL appears in a search result a user could see. The user does not need to scroll to it or click it. Impressions are a measure of visibility and demand. A rising impression count with flat clicks usually means you are gaining visibility but not winning the click.
3. Click-Through Rate (CTR)
CTR is clicks divided by impressions, shown as a percentage. For a deeper definition, see the click-through rate entry on Wikipedia. CTR is heavily influenced by your rank, your title, your meta description and any rich results you earn. A page ranking in position 1 typically gets a much higher CTR than a page in position 8.
4. Average Position
Average position is the average topmost position of your site in results for the selected queries and dates. Because a page can rank differently for different users, locations and devices, this number is an average, not an exact rank. Do not obsess over decimals. Look at the trend instead.
| Metric | What It Tells You | Healthy Signal |
|---|---|---|
| Clicks | Actual visits from Google | Steady or rising over time |
| Impressions | Visibility and demand | Rising with new content |
| CTR | How compelling your snippet is | Improving after title tests |
| Average Position | Where you rank on average | Moving closer to 1 |
The Dimensions You Can Filter By
The real power of google search analytics is in the dimensions. They let you cut the same four metrics in different ways.
- Queries: The search terms people typed. This is your keyword goldmine.
- Pages: Which URLs earned impressions and clicks.
- Countries: Where your audience is located.
- Devices: Desktop, mobile or tablet.
- Search appearance: Rich results, AMP (if applicable), videos, FAQ-style features and similar enhancements. See Google’s guide to structured data to earn more of them.
- Dates: Compare two date ranges to measure change.
You can combine filters. For example, filter by a single page, then switch to the Queries tab to see every keyword that page ranks for. Or filter by country and device to see how your mobile audience in one market behaves.
Step-by-Step: How to Read the Performance Report
Let us walk through the report as if you were opening it for the first time.
Step 1: Choose Your Date Range
By default, Search Console shows the last three months. You can extend it to 16 months, which is the maximum retention window. Use Compare mode to compare, say, the last 28 days with the previous 28 days or with the same period last year. Seasonal sites should always compare year over year.
Step 2: Toggle the Metrics
Click the four metric boxes at the top to turn them on or off. Start with all four on. Notice how clicks and impressions usually move together while CTR and position move inversely to each other.
Step 3: Open the Queries Tab
Sort by impressions to see what people are searching for, then by clicks to see what actually brings traffic. The gap between the two lists is your opportunity list.
Step 4: Open the Pages Tab
Find your top pages and your fastest-declining pages. Click one page, then check its queries, countries and devices.
Step 5: Add Filters
Use the + New filter button to include or exclude queries using exact match, “contains” or regular expressions. Regex filters are especially useful for isolating question queries (for example, queries that start with “how”, “what” or “why”) so you can build FAQ content.
Step 6: Export
Click Export to download CSV data or send it to Google Sheets. The interface displays up to 1,000 rows per table, but exports follow the same limit, so for bigger sites you will need the API or a Looker Studio connection, covered below.
Google Search Analytics vs Google Analytics (GA4)
One of the most common questions beginners ask is whether they need both. The short answer is yes. They measure different things.
| Feature | Google Search Analytics (Search Console) | Google Analytics 4 |
|---|---|---|
| Data source | Google Search logs | Your site’s tracking tag |
| Measures | Impressions, clicks, CTR, position | Sessions, users, events, conversions |
| Shows before the click? | Yes | No |
| Shows after the click? | No | Yes |
| Covers other traffic sources? | No, Google Search only | Yes, all channels |
| Keyword data | Full query data | Mostly hidden (“not provided”) |
Think of it this way: Search Console tells you what happened before the visit; Google Analytics tells you what happened after. Learn the fundamentals of GA4 in Google’s introduction to Analytics, then link the two products so you can see search data inside your Analytics reports.
You may notice that click counts in Search Console do not exactly match sessions in Analytics. That is normal. Analytics can miss visitors who block tracking scripts, while Search Console counts clicks, not sessions. Also, a bounce rate or engagement rate only exists in Analytics, because Search Console never sees what happens on your site.
9 Practical Ways to Use Search Analytics to Grow Traffic
Data is only useful if you act on it. Here are nine proven tactics.
1. Find “Striking Distance” Keywords
Filter for queries with an average position between 8 and 20 and decent impressions. These pages already rank, but not high enough to get clicks. Improve the content, add internal links and refresh the page. Many sites gain their fastest wins here.
2. Fix Low-CTR, High-Impression Pages
Sort by impressions and look for pages with a CTR well below what is typical for their position. Rewrite the title tag and meta description to be more specific and more compelling. Google explains how it generates title links and snippets, which helps you write ones that Google will actually display.
3. Detect Content Decay
Compare the last 3 months with the previous 3 months. Pages with falling clicks but stable impressions are losing the click battle, while pages with falling impressions are losing rankings. Both signal a need for a refresh. A quarterly content refresh is one of the most reliable evergreen SEO habits.
4. Discover New Content Ideas
The Queries report often reveals long-tail searches that you never targeted directly. Each one is a content idea. For more on why these matter, read about the long tail concept. Combine your findings with Google Trends to see whether interest is growing.
5. Identify Keyword Cannibalization
If two pages from your site appear for the same query and swap positions, they may be competing with each other. Filter by a query, open the Pages tab and check. Then merge the pages, differentiate their intent, or use a canonical tag where appropriate.
6. Understand Your Mobile vs Desktop Gap
If mobile impressions are high but mobile CTR or position is poor, you may have a usability or speed issue. Test your pages with PageSpeed Insights and review Google’s guidance on Core Web Vitals.
7. Measure the Impact of Updates
Whenever Google rolls out an update, check your Performance report for changes. Google lists them on the Search Status Dashboard and announces major changes through the Search Central blog and the Search updates page. Annotate your own changes so you can connect cause and effect.
8. Localize Your Strategy
The Countries tab can reveal an audience you did not plan for. If a country brings a surprising share of impressions, consider adding localized content, currency or examples.
9. Validate Structured Data Wins
After adding FAQ, how-to, product or review markup, filter by search appearance to see whether rich results are driving more clicks. Use the Schema.org FAQPage vocabulary as a reference, and always follow Google’s structured data guidelines.
Using the Search Analytics API and Looker Studio
The web interface is great for exploration, but it caps visible data and cannot be automated. That is where the Search Analytics API comes in.
What the API Does
The searchanalytics.query method lets you request clicks, impressions, CTR and position grouped by dimensions such as date, query, page, country and device. You can filter, paginate and fetch up to 25,000 rows per request, which makes it ideal for large sites. Developers can find client libraries and quickstarts in the Search Console API documentation.
A simplified request body looks like this:
{
  "startDate": "2026-01-01",
  "endDate": "2026-03-31",
  "dimensions": ["query", "page"],
  "rowLimit": 25000,
  "startRow": 0
}
Connecting Looker Studio
If you prefer dashboards over code, use Looker Studio, Google’s free reporting tool. It has a native Search Console connector, so you can build live dashboards for clients or your own team. Start with a “site impression” and “URL impression” table to avoid the confusion that comes from mixing the two data sources.
Storing Data Beyond 16 Months
Search Console only retains 16 months of data. If you want long-term history, schedule a monthly export through the API or use the bulk data export to BigQuery. Because evergreen SEO is about compounding results, having years of history lets you spot patterns that short windows hide.
Google Search Analytics for AI Search and AI Overviews
Search is changing quickly. Generative answers, AI summaries and chat-based assistants now sit alongside the classic ten blue links. Many site owners ask how this affects google search analytics.
Google states in its guidance on AI features and your website that content appearing in these AI experiences is counted within the standard Search Console Performance report, rather than in a separate report. That means the best way to track your visibility in Google’s AI experiences is to keep monitoring impressions and clicks, and to watch query patterns, which are increasingly longer and more conversational.
How to Adapt Your Content
- Answer questions directly. Open sections with a short, clear answer, then expand. This helps both featured snippets and AI summaries.
- Show experience and expertise. Google’s helpful content guidance emphasizes original, people-first content.
- Use structured data and clean headings. They help machines understand your page.
- Keep your pages crawlable. Review Google’s robots.txt introduction to make sure you are not blocking important resources.
- Follow Google’s essentials. The Search Essentials document lists the technical, spam and key best-practice requirements.
Search Console also does not tell you about visibility inside third-party chat assistants. For that, track branded searches, referral traffic in GA4 and mentions across the web. For broader industry news on this topic, follow Search Engine Land and Backlinko’s Search Console guide.
Common Mistakes and Data Limitations
Even experienced SEOs misread google search analytics. Watch for these traps.
Mistake 1: Treating Average Position as Exact
Average position blends many searches. A page might rank first for one user and fifth for another. Use it for direction, not for precision.
Mistake 2: Ignoring Anonymized Queries
Google hides some rare queries for privacy. As a result, the sum of the query rows may be lower than your total clicks. This is expected and not a bug.
Mistake 3: Comparing Incompatible Periods
Comparing a holiday week with a normal week will mislead you. Use matching periods and year-over-year comparisons.
Mistake 4: Confusing Site and URL Impressions
When you group by query, impressions are counted per property. When you group by page, they are counted per URL. Totals therefore differ. Always know which view you are looking at.
Mistake 5: Overreacting to Daily Noise
Daily numbers fluctuate. Evaluate at least 28 days, and ideally compare with a similar period before making large changes.
Mistake 6: Forgetting Data Delay
Recent days may be incomplete, and some data arrives with a lag of a day or two. Wait before drawing conclusions about yesterday.
Known Limitations
- 16-month data retention
- 1,000 rows shown per table in the interface
- Only Google Search data, not Bing or other engines (for those, use Bing Webmaster Tools)
- No behavior data after the click
Best Tools to Combine With Search Analytics
No single tool does it all. Here are complementary tools worth knowing.
| Tool | Best For | Link |
|---|---|---|
| Google Search Console | Core search performance data | Open |
| Google Analytics 4 | Post-click behavior and conversions | Open |
| Looker Studio | Dashboards and reporting | Open |
| Google Trends | Demand and seasonality | Open |
| PageSpeed Insights | Speed and Core Web Vitals | Open |
| Yoast SEO | On-page optimization in WordPress | Open |
| Site Kit | Dashboard inside WordPress | Open |
| Bing Webmaster Tools | Bing search data | Open |
| EveryToolfy | Free online utilities for creators and marketers | Open |
If you want a second opinion on your research, compare notes with Semrush and Ahrefs, but always treat Search Console as the source of truth for your own site.
Using the URL Inspection Tool Alongside Analytics
When a page loses impressions, check whether Google can still index it. The URL Inspection tool shows the last crawl, the indexing status and the canonical Google selected. Pair it with your Performance data to find out whether a traffic drop is a ranking problem or an indexing problem.
A Simple Weekly and Monthly Workflow
Consistency beats intensity. Here is a lightweight routine you can follow forever.
Weekly (15 minutes)
- Open the Performance report for the last 28 days and compare with the previous period.
- Scan for sudden drops or spikes in clicks and impressions.
- Check the Pages tab for new pages that began receiving impressions.
- Note two or three queries that deserve a better title or a new section.
Monthly (45 minutes)
- Export queries and pages to a spreadsheet.
- Identify striking-distance keywords (positions 8 to 20).
- Rewrite titles and descriptions on your five biggest low-CTR pages.
- Add internal links from strong pages to the pages you want to lift.
- Record changes in a simple log so you can measure impact later.
Quarterly (2 hours)
- Compare the quarter against the previous quarter and the previous year.
- Refresh your decaying evergreen content.
- Merge or prune thin pages that cannibalize each other.
- Review country and device splits for new opportunities.
- Back up your data beyond the 16-month window.
Frequently Asked Questions
What is google search analytics?
Google search analytics is the performance data in Google Search Console that shows how many times your site appeared in Google Search, how many clicks it earned, its click-through rate and its average position, broken down by query, page, country, device and date.
Is google search analytics free?
Yes. Google Search Console and its Performance report are completely free for any verified site owner. The Search Analytics API is also free to use within its usage quotas.
Where can I find google search analytics data?
Sign in to Google Search Console, select your property and click Performance in the left-hand menu. You will see the clicks, impressions, CTR and position graph with tabs for queries, pages, countries, devices and more.
How often does the data update?
Search Console data updates daily, with a delay of roughly one to two days for the most recent figures. Fresh data may appear first and be adjusted later.
How far back can I see data?
You can view up to 16 months of data in the interface and API. To keep a longer history, export it regularly or send it to a data warehouse.
What is the difference between Search Console and Google Analytics?
Search Console reports on what happens in Google Search before a user visits your site (impressions, clicks, ranking). Google Analytics reports on what users do after they arrive (sessions, engagement, conversions). Use both together.
Why do my clicks differ between Search Console and Analytics?
They use different measurement methods. Analytics relies on a tracking script that can be blocked and counts sessions, while Search Console counts clicks on results. Some difference is normal.
What is a good CTR?
It depends on position, query type and search features. Results in the top positions usually earn much higher CTRs than results lower down, and branded queries earn far more than generic ones. Compare your own pages against each other and over time rather than chasing a universal number.
Can I use the Search Analytics API without coding?
You can use tools such as Looker Studio or Google Sheets add-ons that connect to Search Console data without writing code. Developers who want full control can call the API directly.
Does Search Console show AI Overview data?
According to Google’s AI features documentation, appearances in these features are included in the overall Performance report totals for Search. There is no guarantee of a separate filter, so check the documentation for the latest details.
How do I increase my clicks using search analytics?
Improve titles and descriptions on high-impression, low-CTR pages, refresh pages stuck at positions 8 to 20, add internal links to your best opportunities, answer questions directly, and earn rich results through structured data.
Google search analytics is the most valuable free SEO resource you have. It shows what Google thinks of your site, what searchers want from you, and where your next gains are hiding. The key is not to stare at the dashboard, but to build a habit: check weekly, optimize monthly, refresh quarterly and always record what you changed.
Start today. Verify your property in Google Search Console, open the Performance report, and find your first striking-distance keyword. Then improve that page, wait a few weeks, and measure the result. Repeat this cycle for years and your organic traffic will compound.
Ready to build a smarter SEO workflow? Browse the free utilities at EveryToolfy and put your search data to work.